



Performance Data
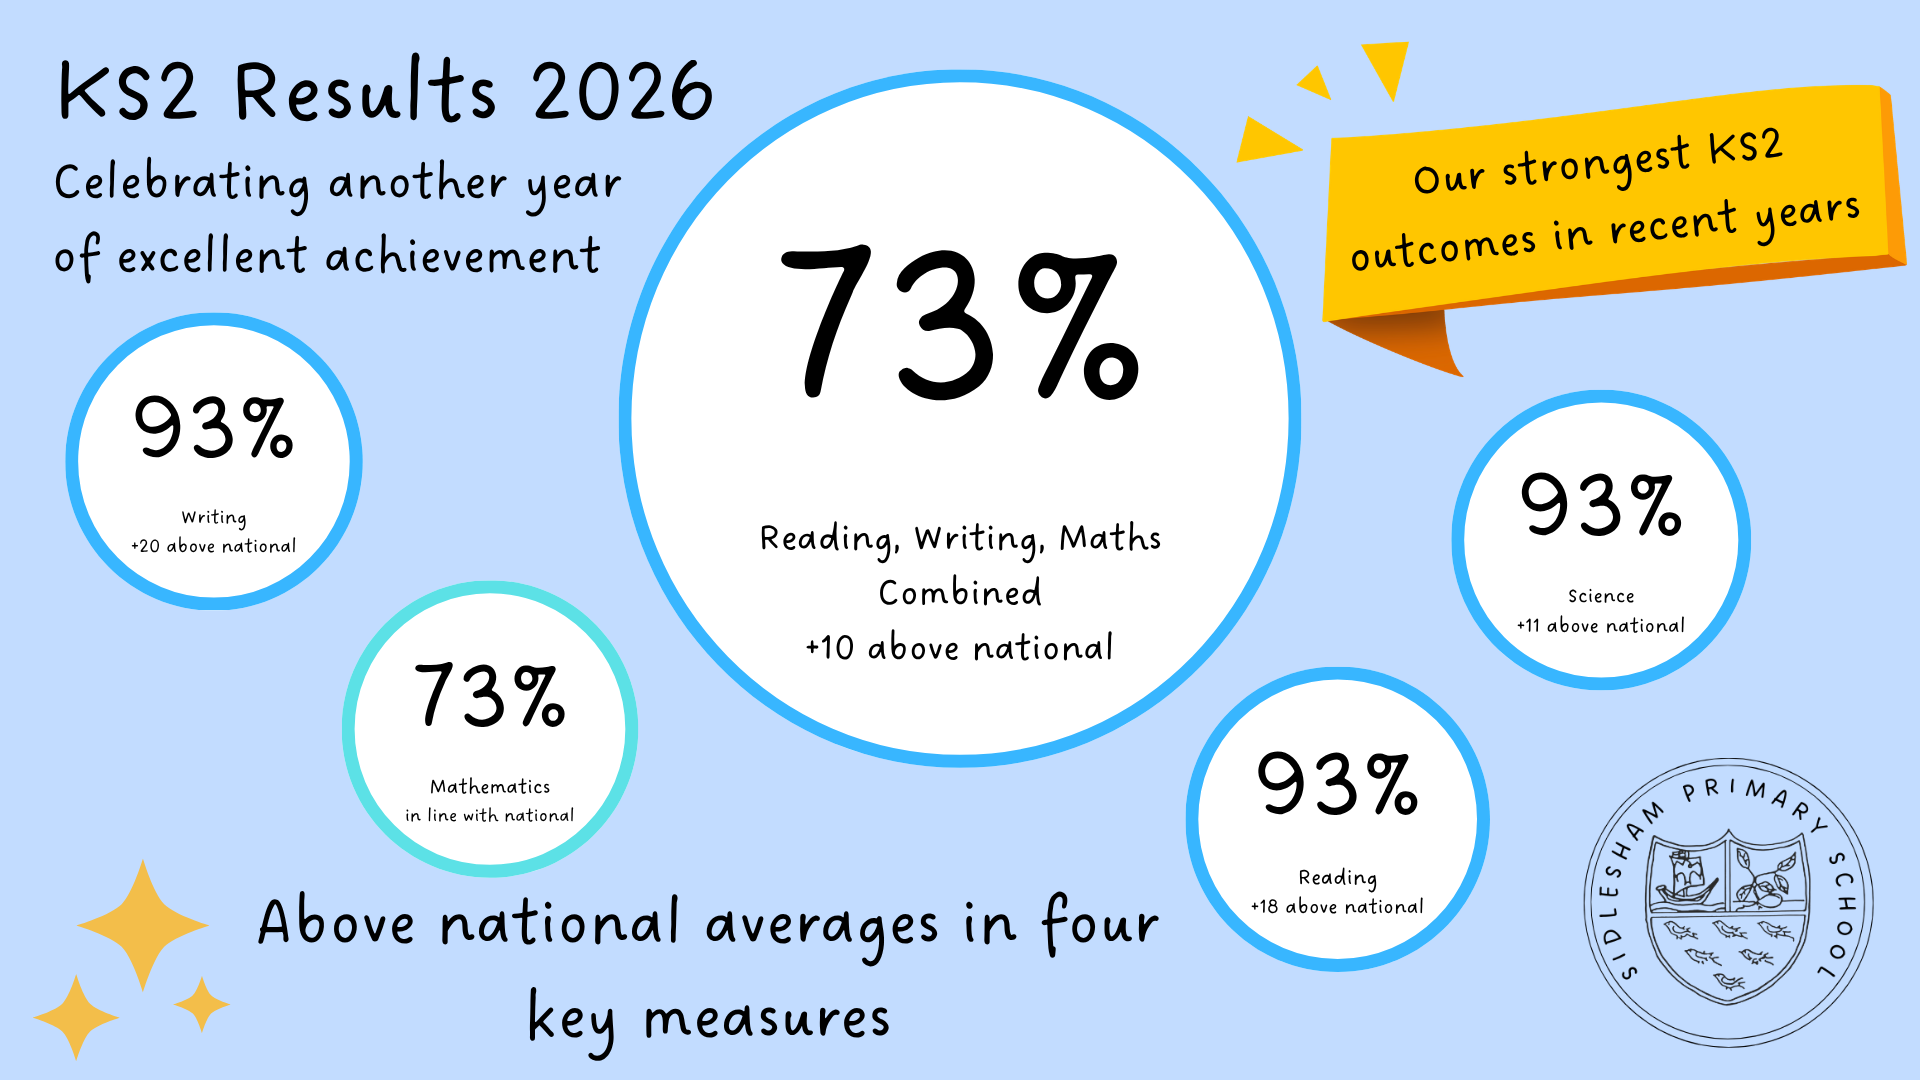
At Sidlesham Primary School, we are ambitious for every pupil. We carefully monitor attainment and progress to identify strengths, address gaps and ensure that pupils are well prepared for the next stage of their education.
School performance data should be considered alongside other information about the school. Sidlesham has relatively small year groups, so the outcomes of individual pupils can have a significant effect on percentages.
Department for Education performance information
You can view Sidlesham Primary School’s full performance information on the Department for Education’s Compare School and College Performance service:
View Sidlesham Primary School’s performance information
Statutory Key Stage 2 performance measures
These are the most recent Key Stage 2 results published by the Secretary of State. They relate to pupils who completed Key Stage 2 in summer 2025 and were published in April 2026.
| Measure | Sidlesham | West Sussex | England |
|---|---|---|---|
| Pupils achieving the expected standard in reading, writing and mathematics combined | 60% | 60% | 62% |
| Pupils achieving a higher standard in reading, writing and mathematics combined | 0% | 6% | 8% |
| Average scaled score in reading | 105 | 106 | 106 |
| Average scaled score in mathematics | 100 | 104 |
105 |
Key Stage 1 to Key Stage 2 progress scores are not available for the 2024/25 cohort because there was no statutory Key Stage 1 baseline from which to calculate progress measures due to the disruption caused by COVID-19.
Our 2026 outcomes
Our most recent school outcomes are from summer 2026. These results have been confirmed by the school but have not yet been published on the Department for Education’s school performance service.
Key Stage 2
| Measure | Expected standard |
Higher standard |
|---|---|---|
| Reading | 93% | 33% |
| Writing | 93% | 20% at greater depth |
| Mathematics | 73% | 7% |
| Reading, writing and mathematics combined | 73% | - |
Other statutory assessments
- Year 1 phonics screening check: 91%
- Year 4 multiplication tables check: average score of 22.6 out of 25, with 42% of pupils scoring full marks
- Early Years Foundation Stage: 72% achieved a good level of development
How we use performance information
School leaders, teachers and governors use performance information to:
- identify strengths and areas for further development;
- monitor the attainment and progress of different pupil groups;
- identify pupils who require additional support or further challenge;
- evaluate the impact of teaching and intervention;
- inform school improvement planning;
- hold leaders to account for pupils’ outcomes.
We consider performance information alongside pupils’ work, assessment information, attendance, behaviour and wider personal development. Particular attention is given to the outcomes of disadvantaged pupils and pupils with SEND.
Our priorities for 2026/27
Our current School Development Plan priorities are to:
- Raise achievement, with a particular focus on mathematics and ensuring that all pupils receive consistently high-quality teaching.
- Improve attendance, particularly for disadvantaged pupils and pupils with SEND.
- Strengthen personal development and readiness for learning, ensuring that pupils demonstrate our expectations of being Ready, Respectful and Safe.
Across all three priorities, we maintain a strong focus on inclusion, safeguarding and wellbeing, high expectations, and our school values of ambition, confidence and kindness.
Further information
Parents and carers receive information about their child’s attainment and progress through parents’ evenings and annual reports. If you would like further information about your child’s progress, please speak to their class teacher.
Questions about whole-school performance can be directed to the school office.